B2B SaaS · Marketing analytics · Dashboard design · 0 to 1
Ecomally
Turning scattered ad data into clear budget decisions for D2C brands.
- Role
- Sole product designer, end to end
- Company
- Digi Sidekick
- Timeline
- Apr 2025 – May 2026
- Platform
- Web dashboard (SaaS)
- Status
- In development; early brands already onboarded
Ecomally brings Meta and Google ad data, creative performance and customer journeys into one dashboard. It shows D2C brands what is actually driving their sales, and where to put their next rupee. I designed it from scratch as the only designer, from research and user interviews to the final UI.

Every platform has its own dashboard, and every platform takes credit for the sale.
D2C brands advertise on Meta (Facebook and Instagram) and Google at the same time. Each platform has its own reports, its own metrics and its own claim about which sales it caused. To answer a simple question, marketers switch between dashboards, export reports and compare numbers by hand.
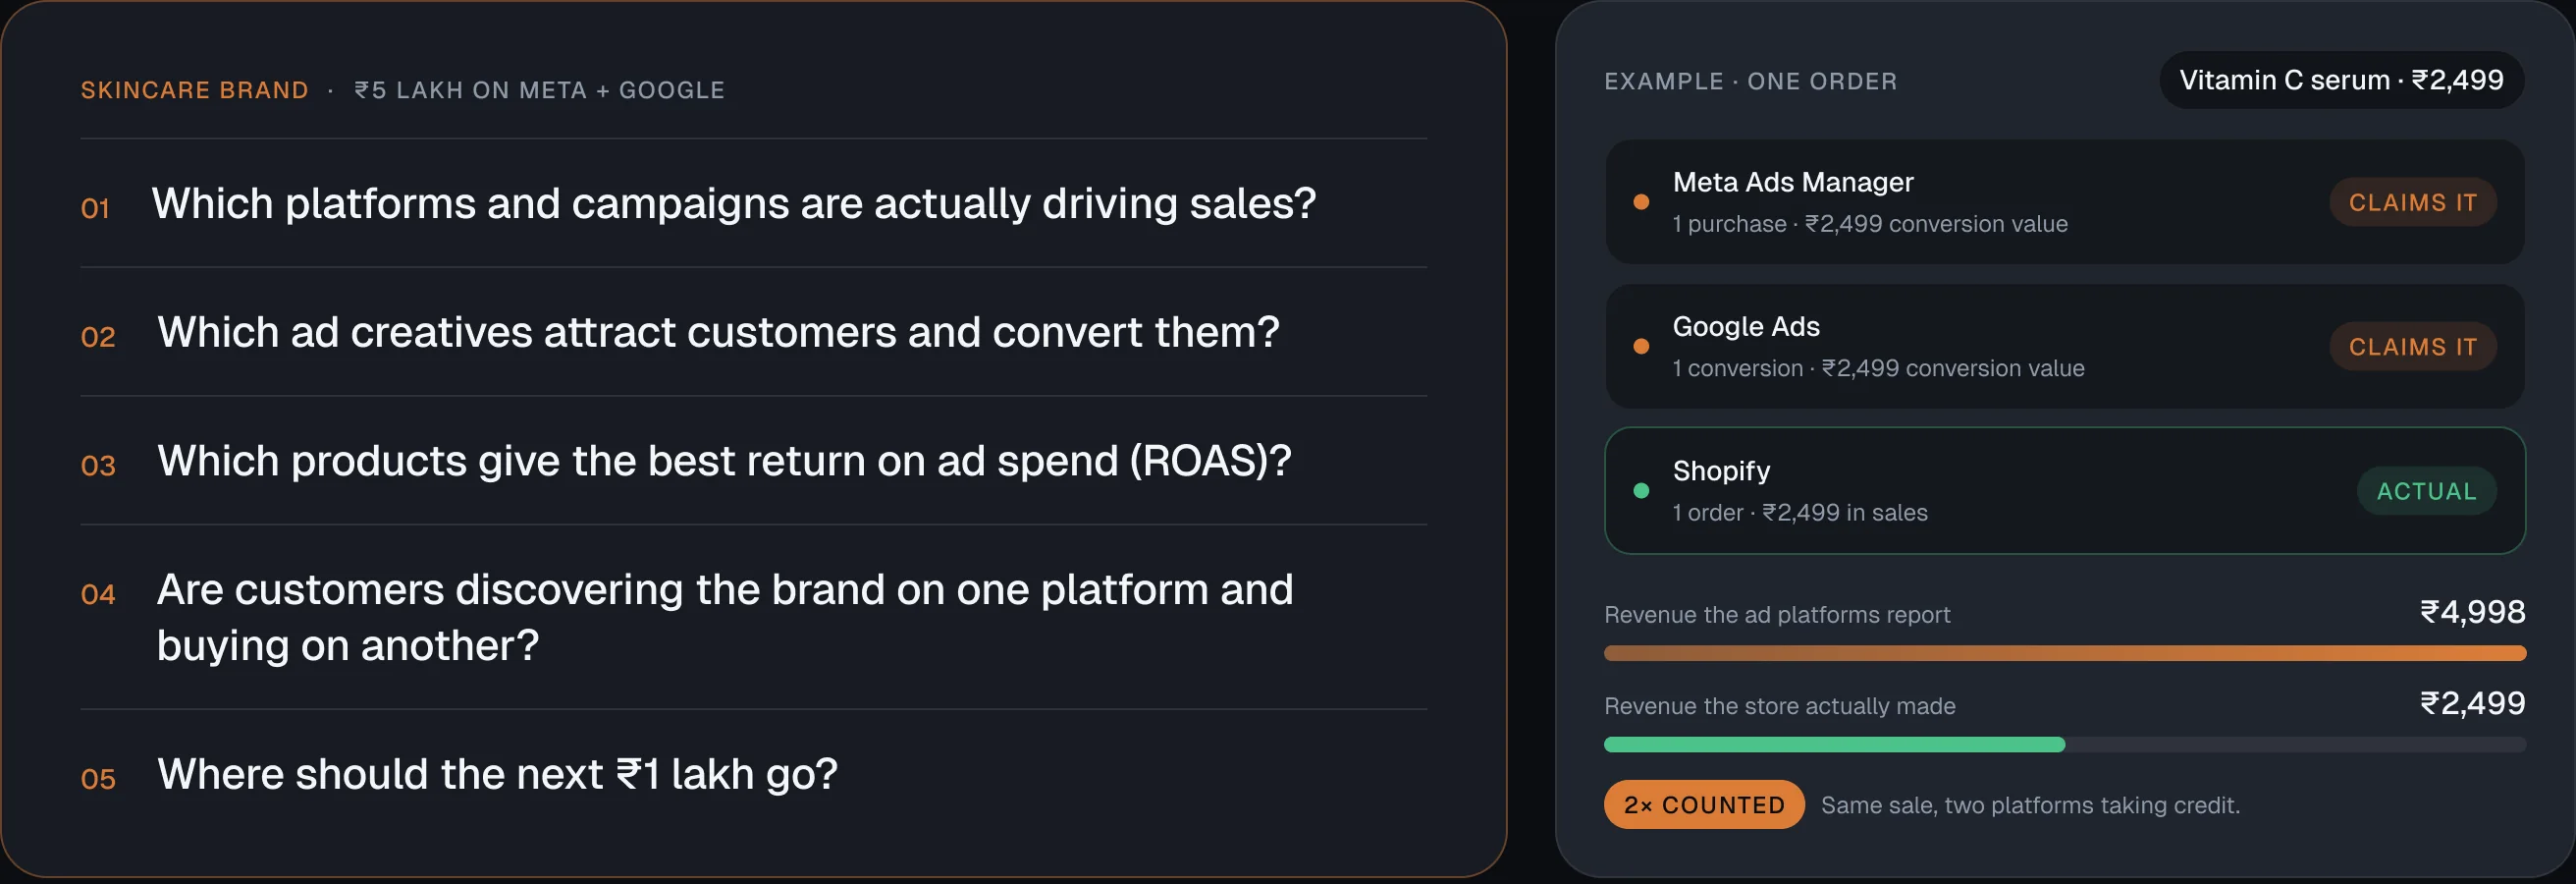
Imagine a skincare brand spending ₹5 lakh on Meta and Google ads. The team needs to know:
Skincare brand₹5 lakh on Meta + Google
- 01Which platforms and campaigns are actually driving sales?
- 02Which ad creatives attract customers and convert them?
- 03Which products give the best return on ad spend (ROAS)?
- 04Are customers discovering the brand on one platform and buying on another?
- 05Where should the next ₹1 lakh go?
- Meta Ads Manager1 purchase · ₹2,499 conversion valueClaims it
- Google Ads1 conversion · ₹2,499 conversion valueClaims it
- Shopify1 order · ₹2,499 in salesActual
2× countedSame sale, two platforms taking credit.
Without one connected view, none of these has a clear answer. So the brand keeps funding every platform, and money burns on all of them.
Three kinds of users, one shared question: is my marketing working?

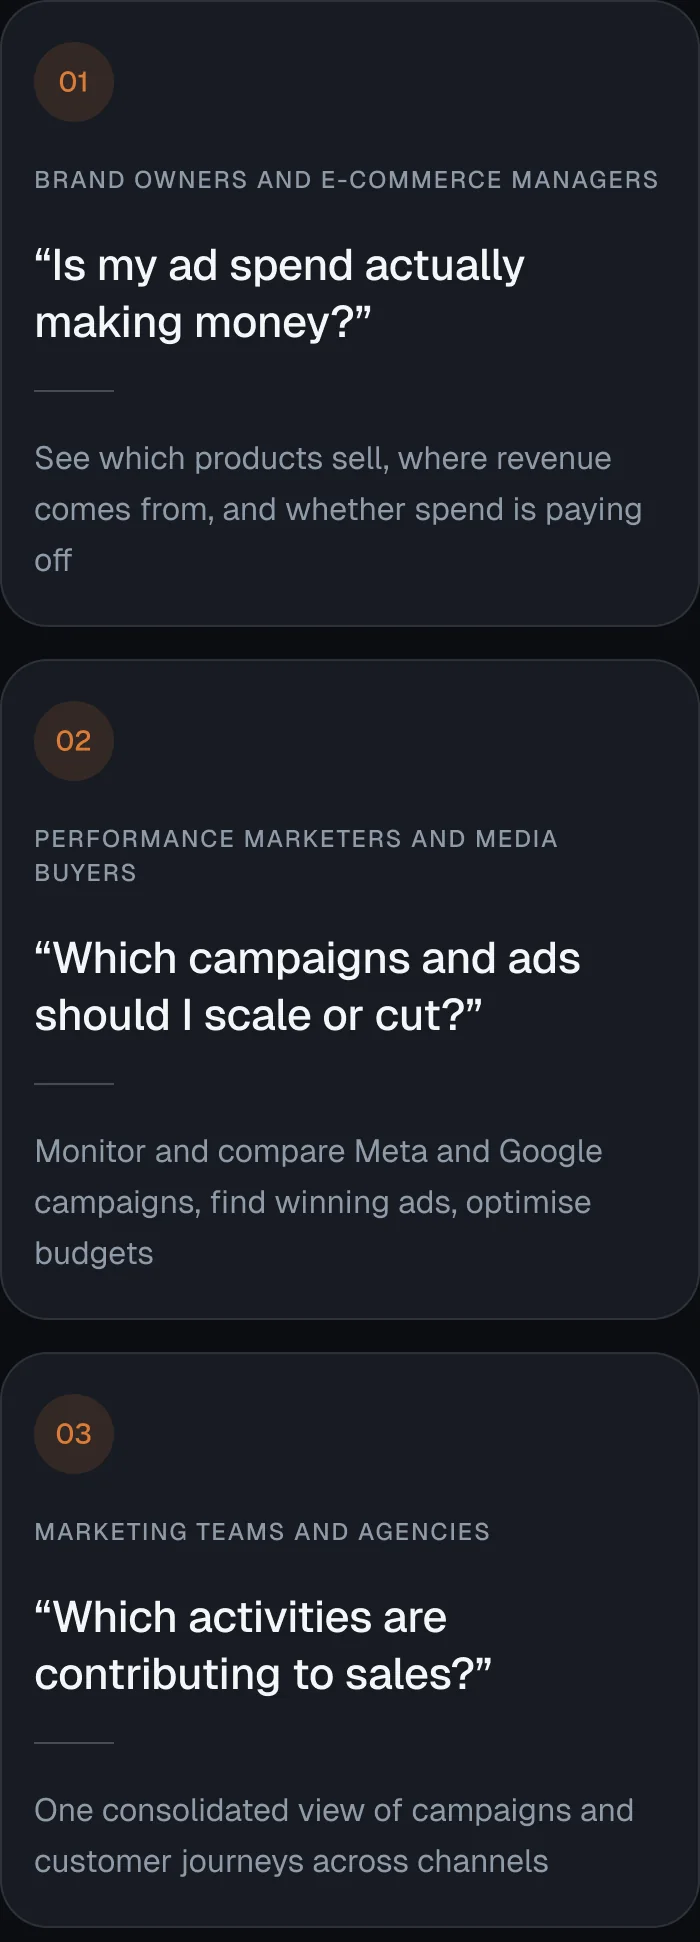
A typical day in Ecomally: check the campaign dashboard, compare Meta and Google, review creative performance, analyse products, follow customer journeys, and plan the next budget.
I was the only designer on Ecomally and owned the design end to end.
- Competitive research across five marketing and e-commerce dashboards
- Interviews with the marketers who use these tools every day
- Information architecture: deciding what each section holds and what comes first
- UX and UI for every screen, built from scratch
- Working with the developers who built the data and attribution logic behind the screens
The client’s brief was clear: make it easy to use, and make it look modern and engaging at first glance, not like the dated dashboards marketers were used to. Usability could not be traded away for looks.

- 01Research
- 02Interviews
- 03Structure
- 04UX
- 05UI
The existing dashboards all followed a similar pattern, so I asked the people using them what they actually needed.
Competitive Analysis
I studied five dashboards that marketers and e-commerce teams already use.

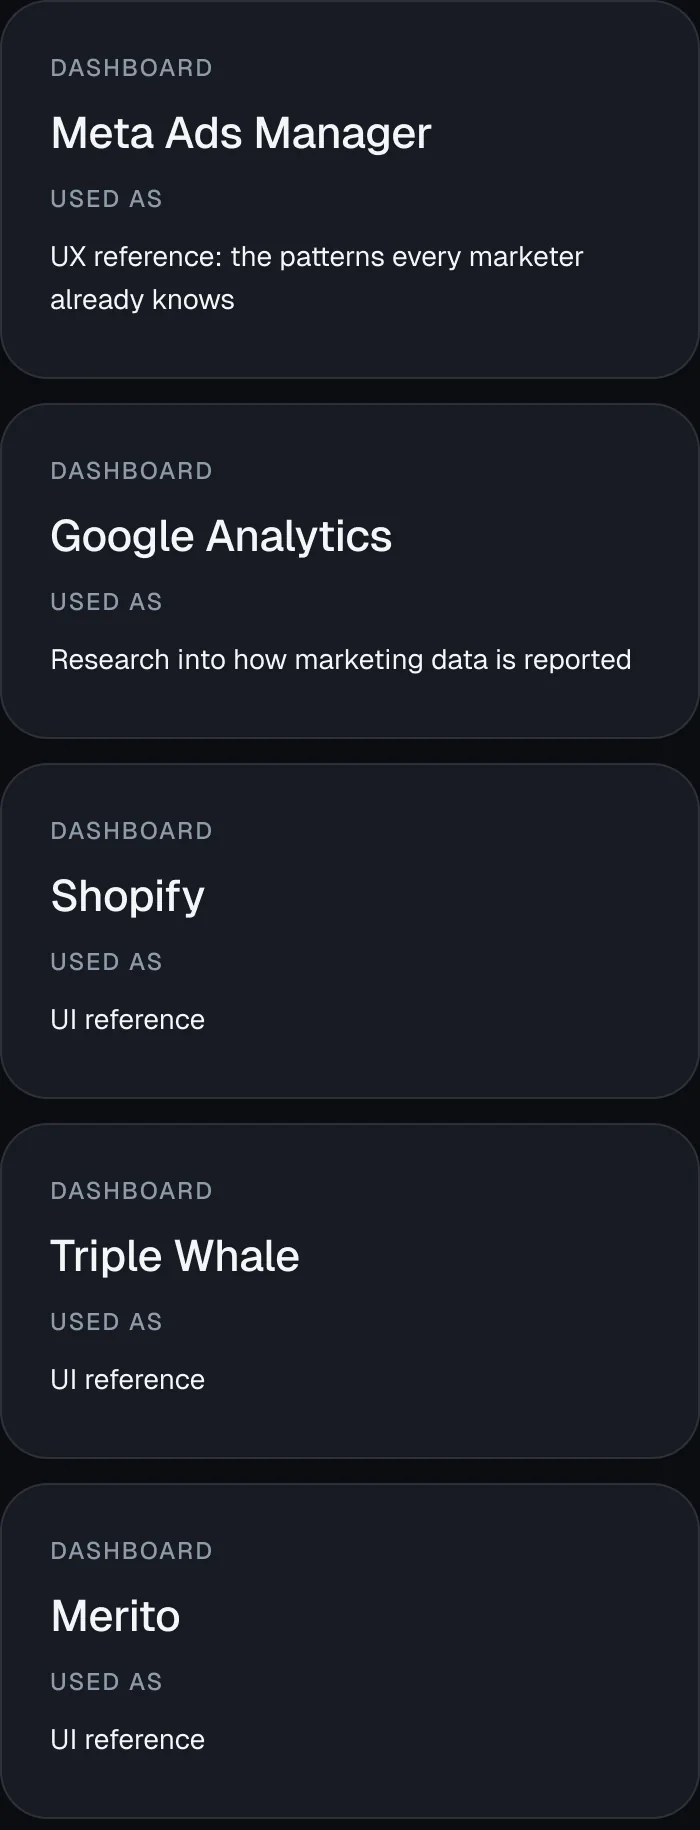
Meta was the most familiar to marketers, but it looked outdated next to newer tools. That set up the challenge: keep the UX marketers trust, with a far more modern UI.
Marketer Interviews
Rather than copy the common pattern, I interviewed the marketers at Digi Sidekick who work across these dashboards every day. I asked what they look at first when they open an ad account, and what slows them down today. Their answers decided the sections of the product and the order of the dashboard.
Key Insight
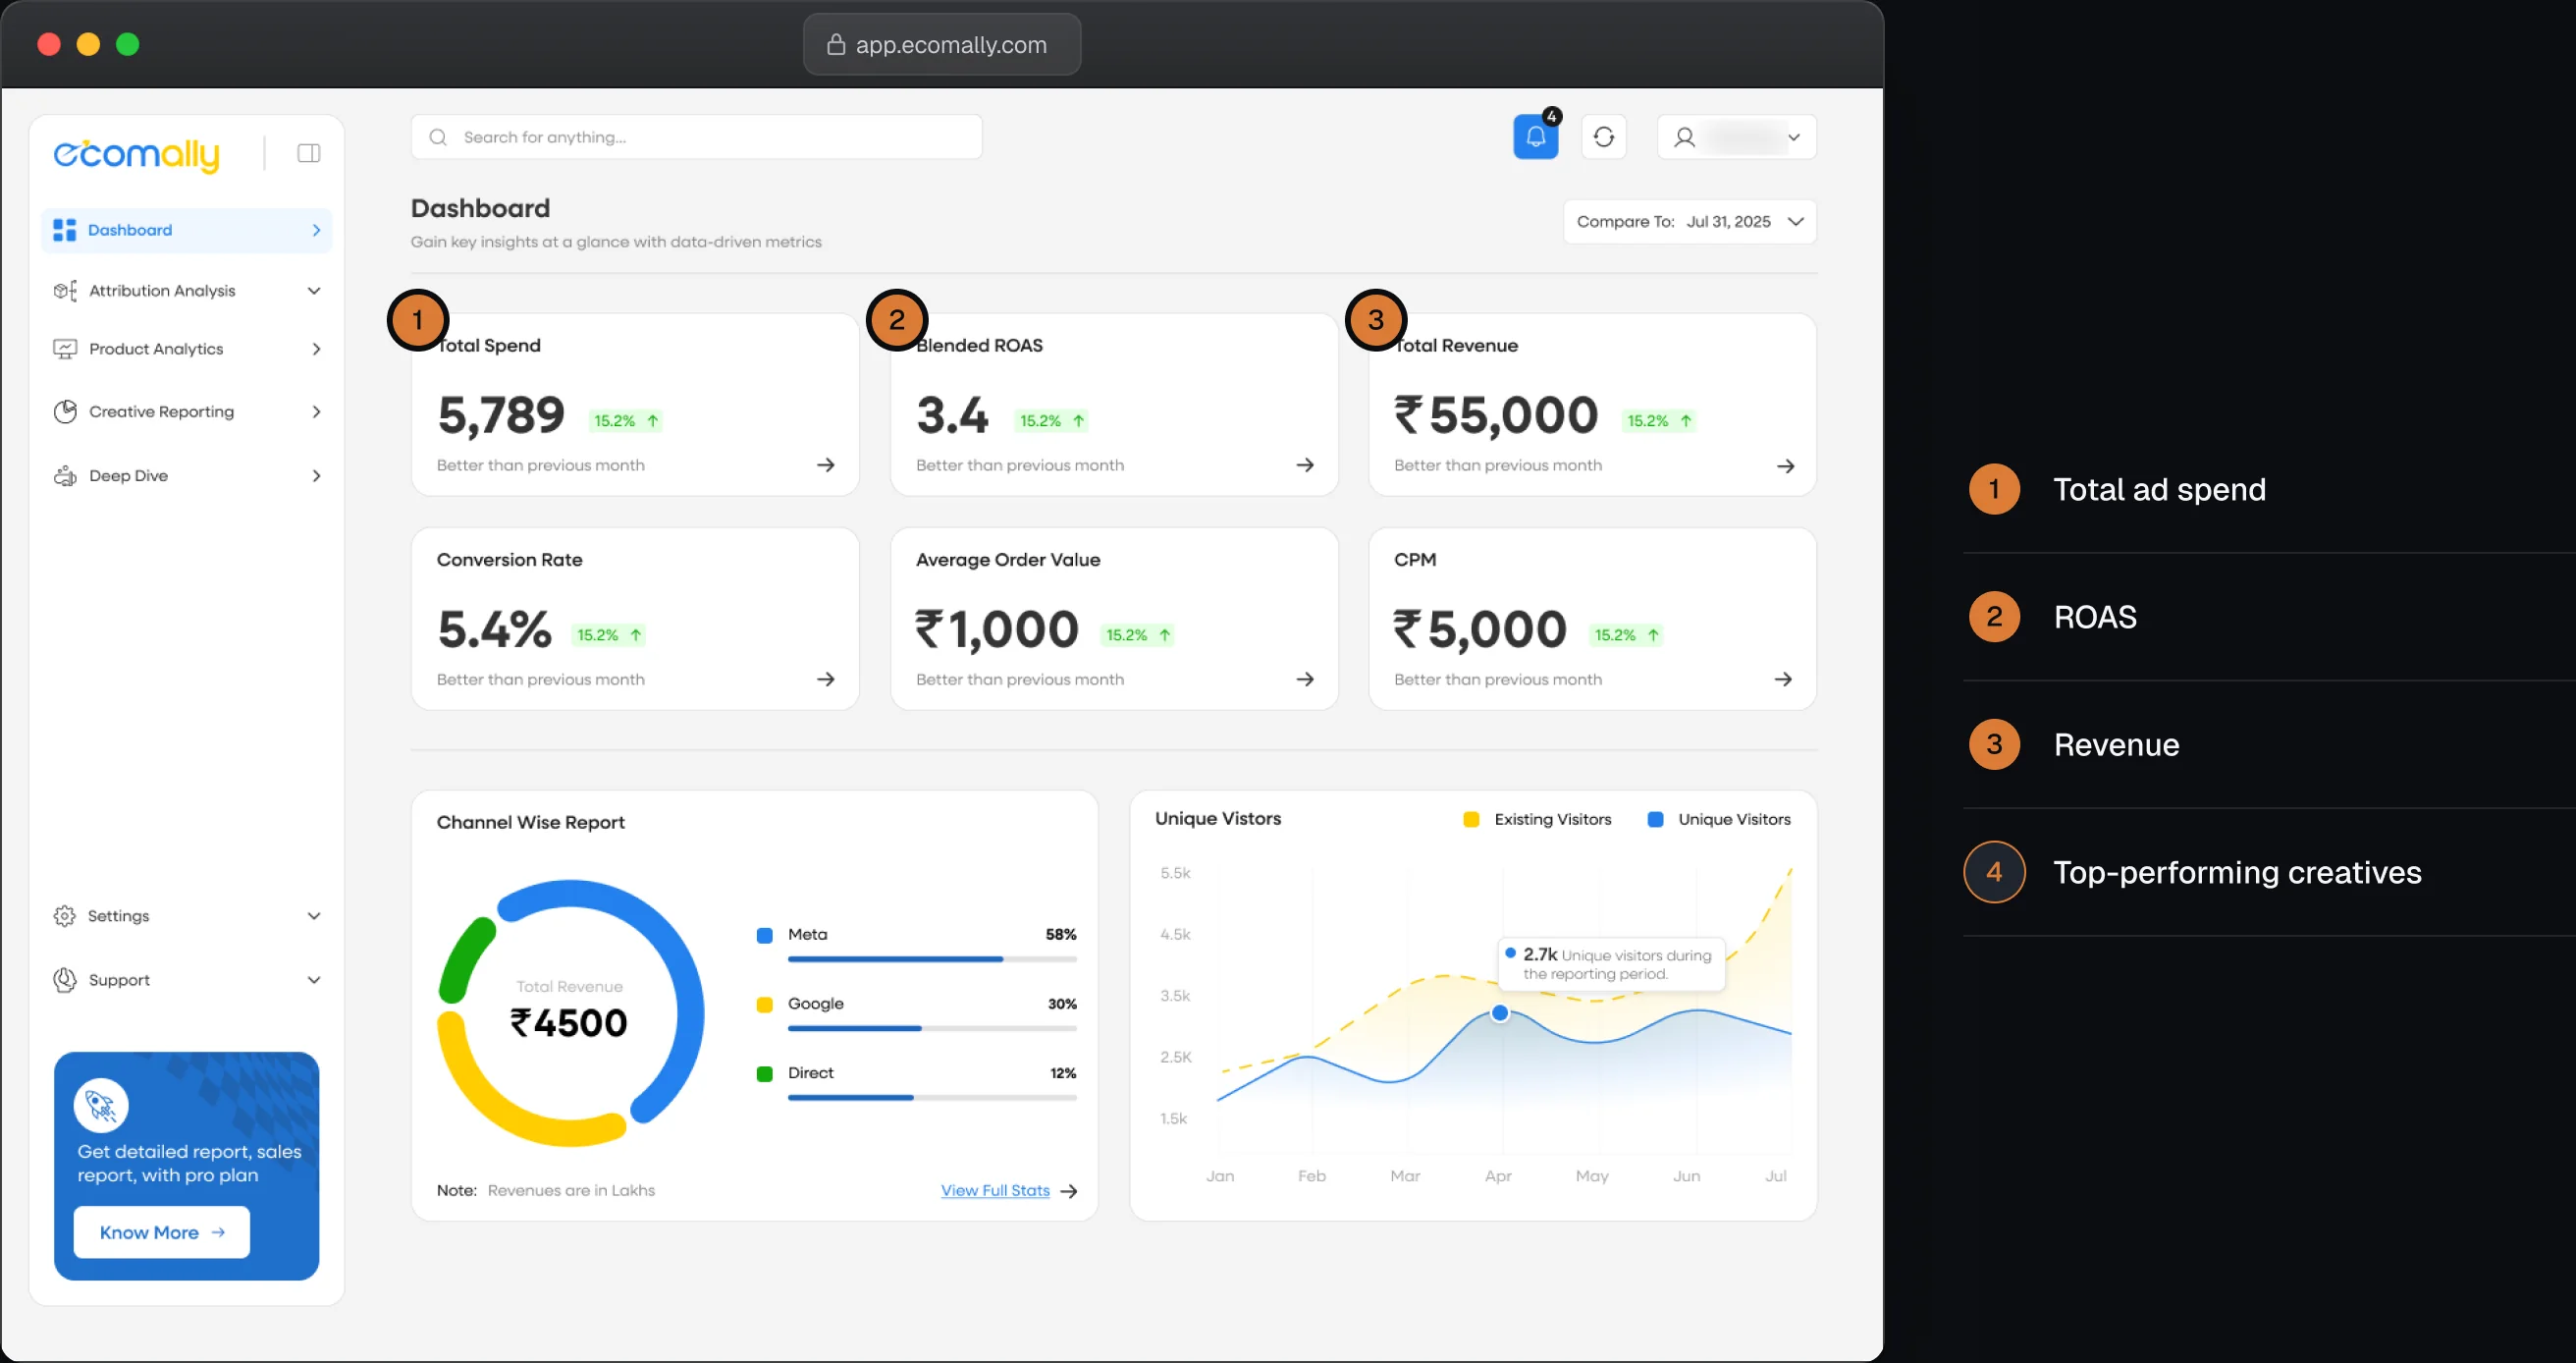
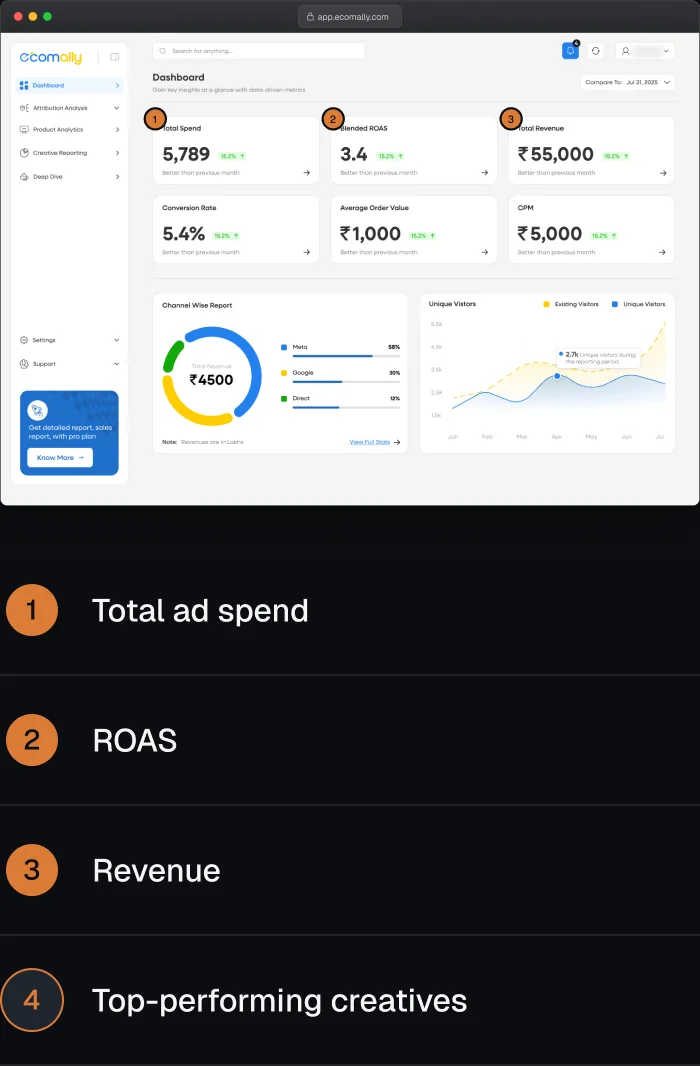
Every morning, marketers and brand owners check the same four things first: total ad spend, ROAS, revenue, and which creatives are performing. The dashboard had to answer those before anything else.
Design Goals
- One connected view of every platform, instead of many separate dashboards
- Answer “is my marketing working?” in the first few seconds
- Look modern and engaging without losing the depth marketers need
Three decisions shaped the product, each driven by what marketers told me.
1. Lead with the Four Numbers Marketers Check First
- Problem
- A brand owner opening Ecomally in the morning wants to know, in seconds, whether their ads are working.
- Decision
- The top of the dashboard shows total ad spend, ROAS, revenue and top-performing creatives for the selected account. These are the four things marketers told me they check first.
- Why
- A brand owner sees at a glance whether marketing is paying off. A marketer sees where to dig in and optimise.
2. Show Which Platform Really Drove the Sale
- Problem
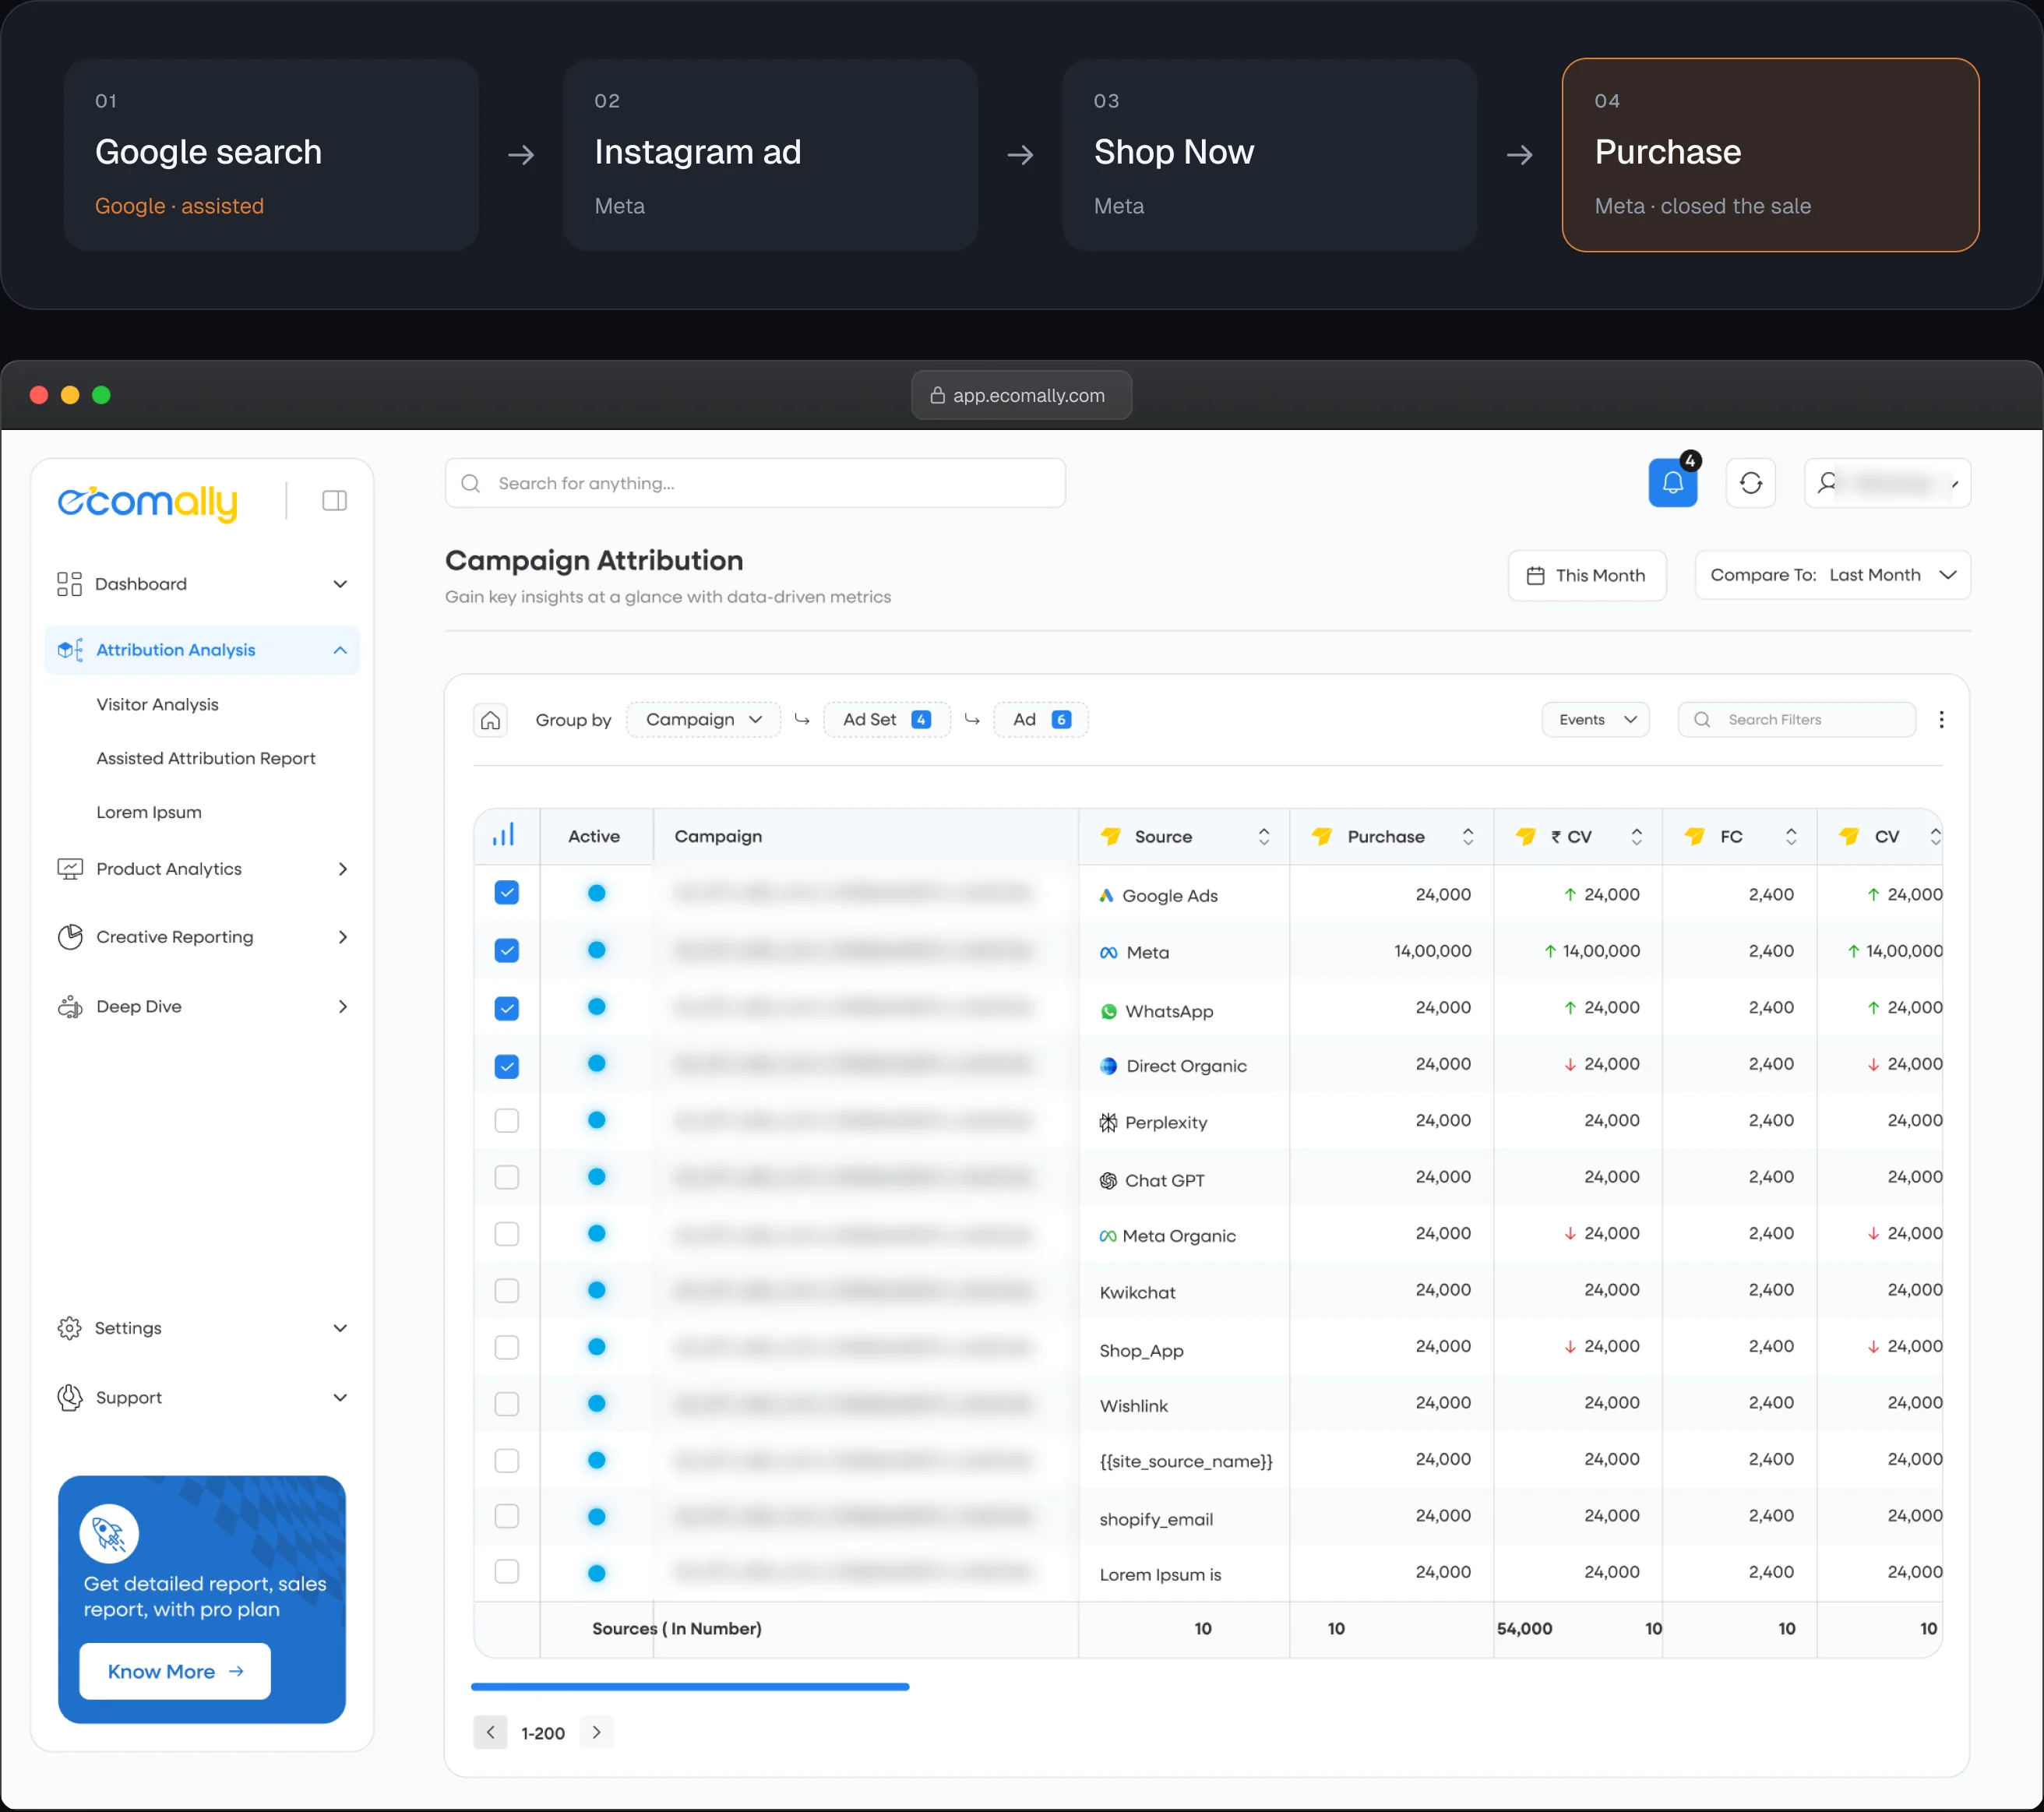
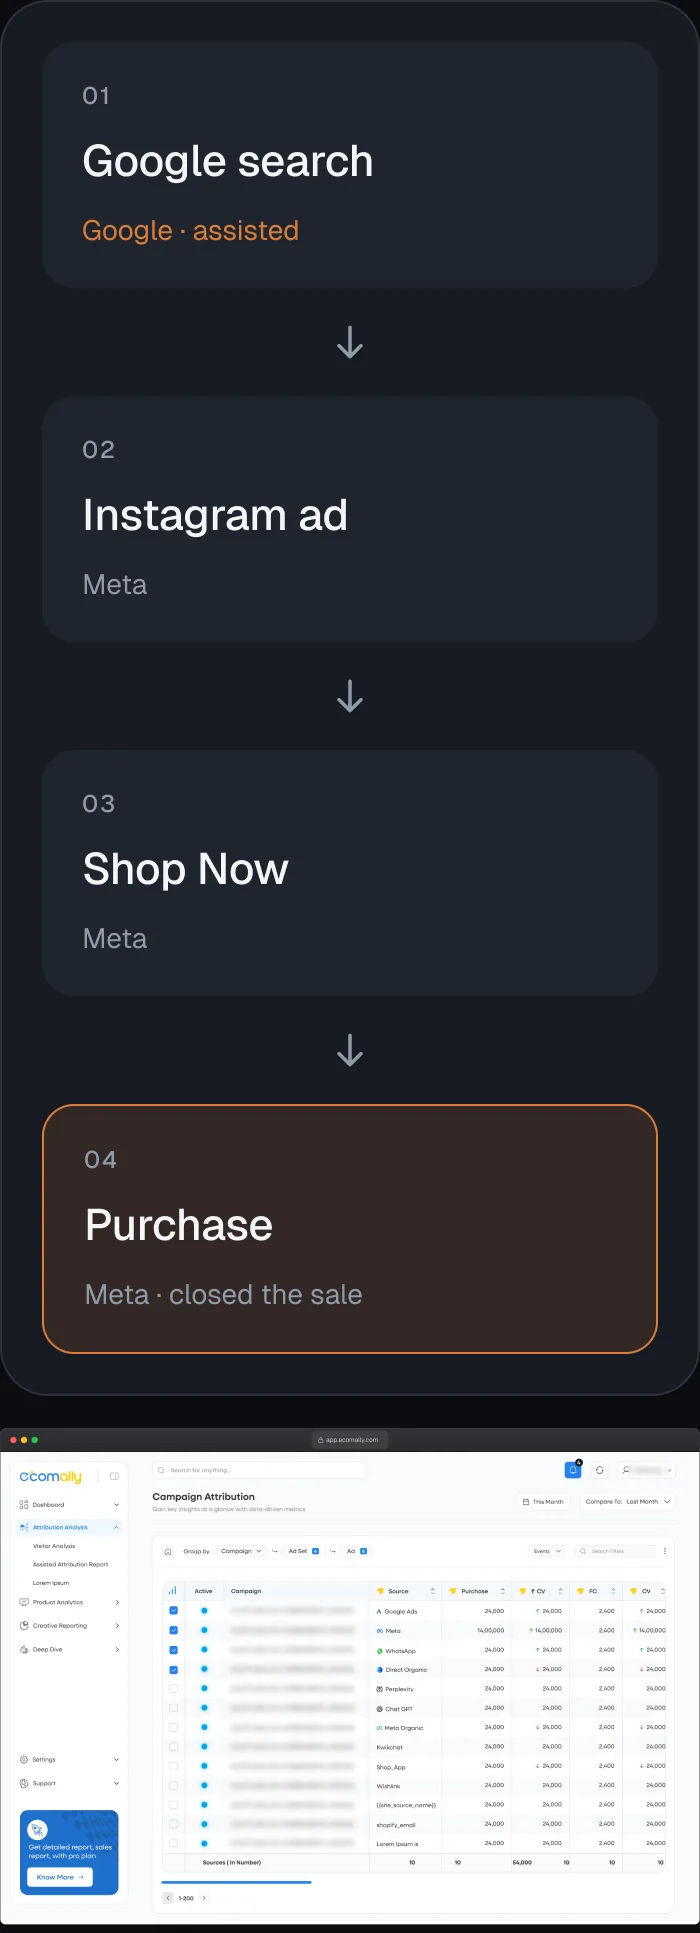
- A shopper searches for shoes on Google. Later they see the brand’s ad on Instagram a few times, tap Shop Now and buy. Meta reports the sale as its own, and so does Google. The brand owner can’t tell which platform is working, so they keep paying both.
- Decision
- An attribution view that puts Meta and Google side by side and shows assisted conversions. In this example, Google assisted and Meta closed the sale.
- Why
- The brand can shift budget with confidence, for example 70% to Meta and 30% to Google, instead of splitting it blindly.
- Scope
- Developers built the attribution logic. I designed how the comparison and the insight are shown.
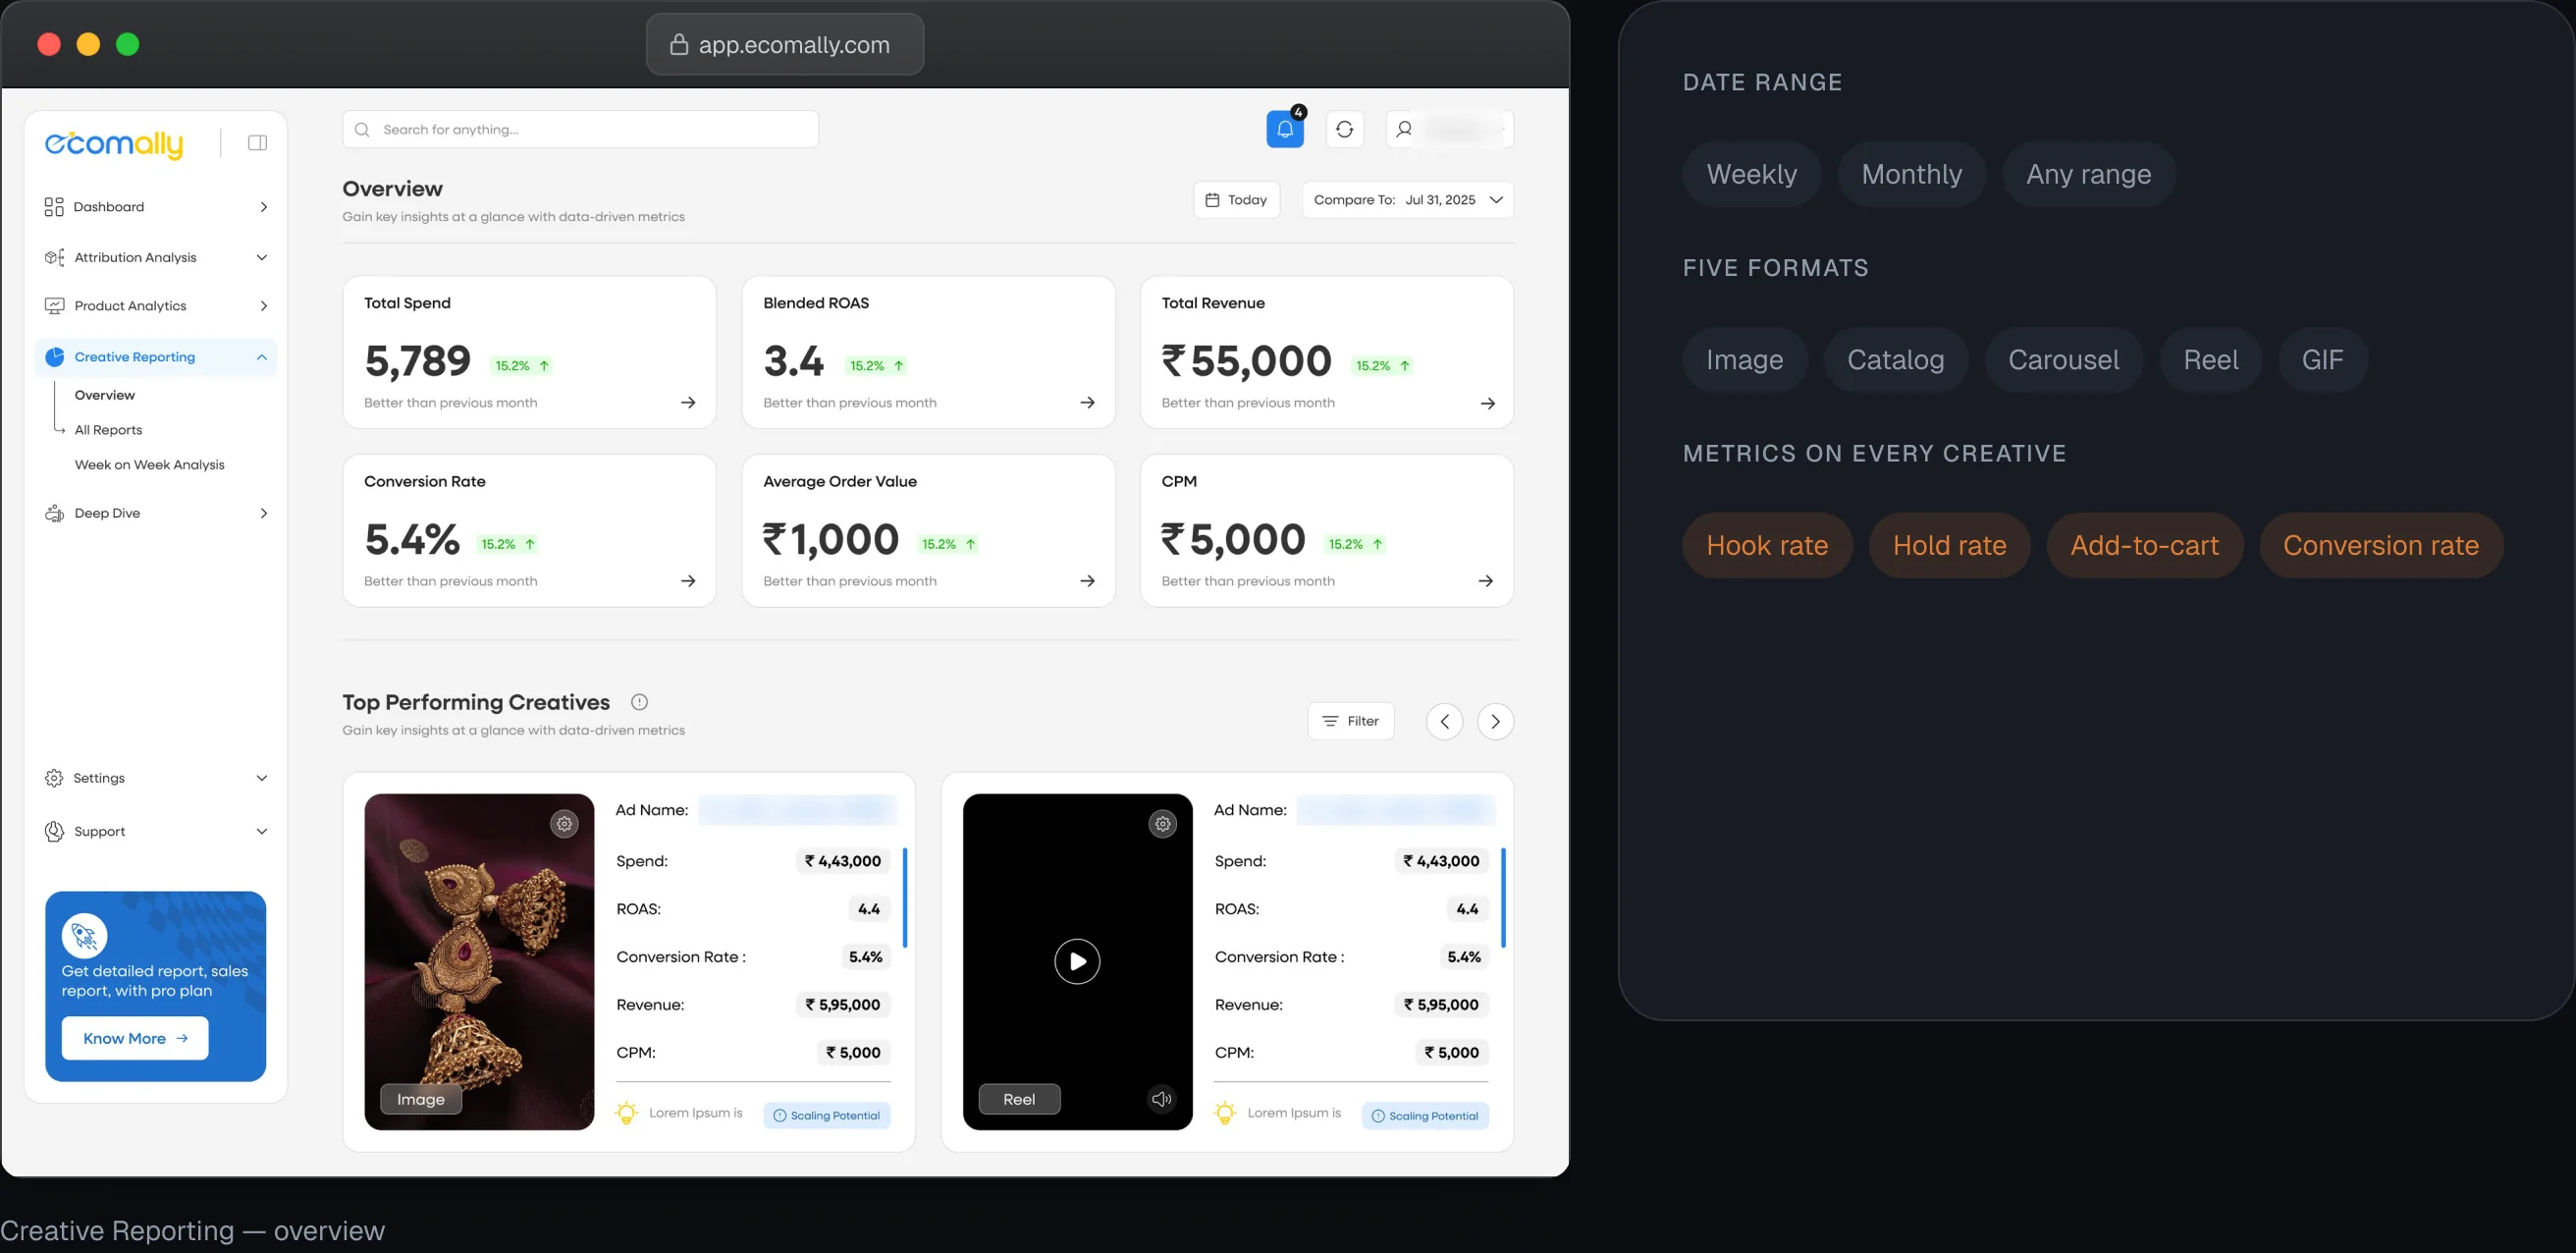
3. Rank Creatives by What Actually Sells
- Problem
- Marketers need to know which ads to put more money behind, across very different ad formats.
- Decision
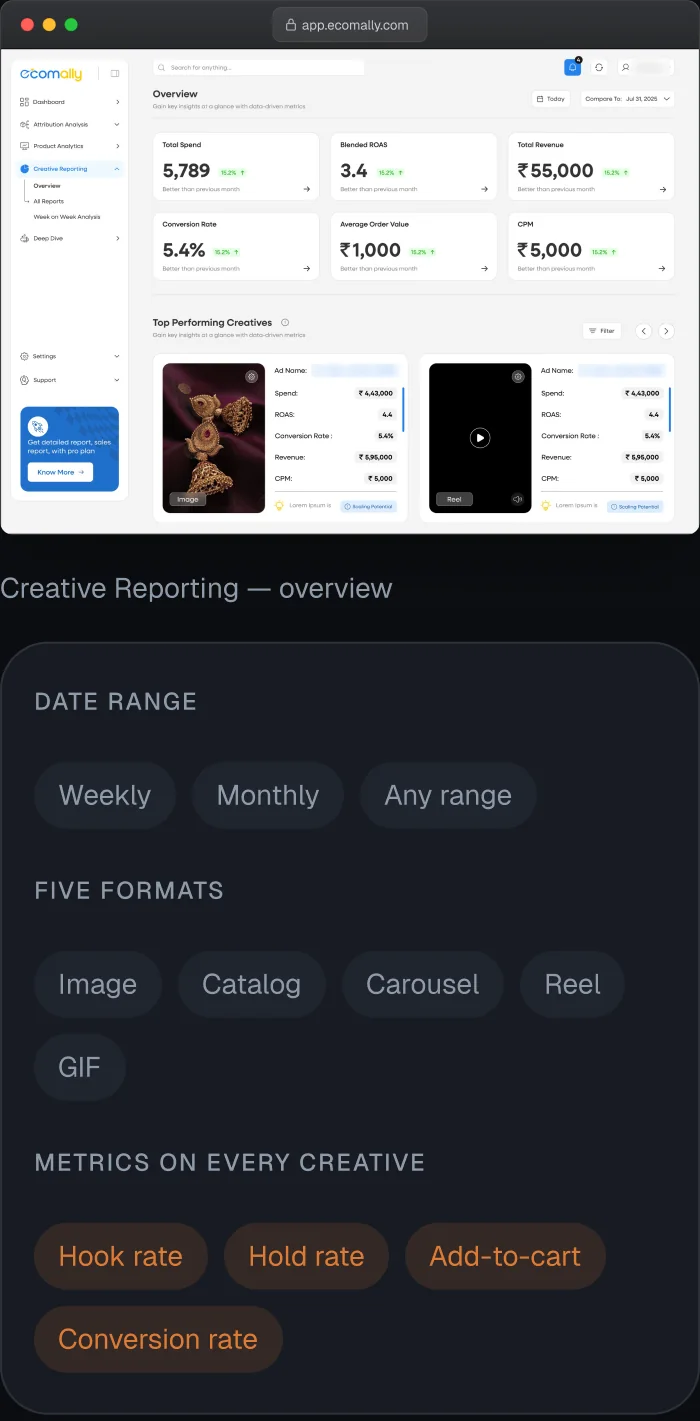
- A Creative Reporting section with a date range at the top, as in Meta (weekly, monthly or any range). The best-performing creatives sit at the top. It covers all five formats: image, catalog, carousel, reel and GIF. Each creative shows the metrics marketers judge ads by: hook rate, hold rate, add-to-cart and conversion rate.
- Why
- The brand sees which kind of ad works on which platform, then puts its money behind the winners to scale.
Two more views complete the picture.
- Customer journey: follows how customers move from their first interaction with an ad to a purchase, across platforms.
- Product performance: shows which products sell best and which give the best ROAS, so brands can separate high performers from underperformers.


Brands started onboarding before the product even launched.

The hardest part wasn’t the design. It was learning marketing first.
I came from app and website design, not marketing. I couldn’t design on assumptions, so I learned how marketers think, from ROAS and attribution to hook rate, by talking to them before designing the dashboard. That’s why user interviews sit at the centre of this project.
What I’d do differently: interview marketers from other brands and agencies too, not only my own team, to test the product against a wider range of needs.

Open to UI/UX & product design roles